

Ticket Sales Tracking: Seat Level Sell Through for Cultural Teams

Updated: 3 days ago

The fastest way to control event revenue is a real-time ticket-sales dashboard wired to your ticketing and marketing data. Pair that live feed with a short list of core KPIs and channel attribution, and you get the ability to act on pricing, promotions, and inventory before a slow on-sale turns into a half-empty house. Everything else in this guide builds toward that one setup.
TL;DR:
Accurate capacity data and sell-through percentages are essential for reliable ticket sales tracking, especially when analyzing section-level performance.
Monitoring velocity hourly during initial sale days and promotional pushes provides early warnings of potential stalls or declines in sales momentum.
Integrating ticketing, campaign, and referral data through API or automation ensures timely insights for decision-making and reduces manual errors.
Setting predefined triggers like early sell-through thresholds or declining velocity helps quickly adjust prices, promos, or inventory to maximize revenue.
Small organizations can effectively use simple spreadsheets with key columns, but larger teams benefit from integrated dashboards that support real-time, multi-platform tracking.
Table of Contents
What Metrics Actually Belong on a Ticket Sales Tracking Dashboard?
Not every number deserves a spot on your screen. The metrics that matter are the ones that tell you whether a show is pacing toward sellout or toward a discounted last-minute scramble.
Sell-through is your ticket count sold divided by total capacity, and it only means anything when your dashboard has accurate capacity per section loaded in first. Without that number set correctly, sell-through math falls apart no matter how polished the reporting looks. Velocity is the rate of change, how fast tickets are moving day over day, and it’s usually the earlier warning sign. A show can look fine on sell-through and still be losing momentum on velocity.
Build your tracking around these core figures:
Tickets sold and revenue, both cumulative and daily
Average order value (AOV), which flags whether upsells and packages are working
Comps and refunds, tracked separately so they don’t quietly inflate your net numbers
Sell-through by section, not just venue-wide, since a sold-out orchestra with an empty balcony tells a different story than an even sellout
Scan rate on event day, which validates your presale numbers against actual attendance
Pro Tip: Check velocity hourly during the first 48 hours of an on-sale and during any promotional push, then drop to a daily check once sales stabilize.
Real-time dashboards that flag pace changes let you catch a stalling on-sale days before a static end-of-week report would even show a problem. Layer in channel attribution using UTM parameters, unique promo codes, and referral links so you know which campaign, partner, or platform is actually driving each sale, not just that a sale happened.
Which Tracking Method Fits Your Event’s Size and Budget?
The right tool depends less on your total capacity and more on how many shows you run per year and how much campaign complexity you need to untangle.
Enterprise dashboards. Built for venues and promoters running frequent on-sales across multiple shows. They typically pull in ticketing data automatically, calculate sell-through and break-even progress in real time, and support multiple users watching the same numbers. The tradeoff is cost and a setup phase that demands clean data feeds.
Ticketing-native reporting. Most box office platforms include built-in reports covering live sales, referral tracking, and one-click exports for attendee and order data. This works well if you run one platform exclusively and don’t need to blend ticketing data with ad spend or social signals.
Spreadsheet templates. Manual but flexible, and often the right starting point for a single annual gala or a small theater running a handful of productions a year.
Hybrid connectors. CSV or API bridges that pull ticketing data into a spreadsheet or lightweight dashboard, giving you some automation without the full cost of an enterprise platform.
A few rules of thumb apply across all four:
If you’re running fewer than five events a year, a template beats a dashboard subscription on cost alone.
The moment you’re managing more than one ticketing platform or comparing paid campaigns against sales, you need integration, not manual entry.
API access beats CSV exports for anything you check more than once a day, since CSV pulls tend to lag by hours.
Whatever category you land in, prioritize integration capability first. A dashboard with beautiful charts and no API or CSV connector to your ticketing platform is a dead end.
How Do You Set Up Ticket Sales Tracking Correctly?
Getting tracking right the first time saves you from discovering a data gap mid-campaign, when it’s too late to fix cleanly.
Pick your primary data source. Use your ticketing platform’s API if it offers one. Manual CSV exports work but introduce lag and human error.
Map your required fields. At minimum: ticket type, price, section, promo code, and purchase timestamp. Skip the promo code field and you lose the ability to attribute sales to specific campaigns later.
Reconcile day one. Compare your dashboard’s first-day numbers against your ticketing platform’s own report. Any mismatch here means a mapping error, not a data glitch you can ignore.
Layer in campaign tracking. Attach UTM parameters to every paid link, issue distinct promo codes per partner or channel, and use referral links for any affiliate or presenter partnership.
Automate the export schedule. Set exports to run daily at minimum, hourly during an active on-sale window.
Run a weekly validation check. Spot-check scanned attendance against sold tickets after each event to catch drift before it compounds across a season.
Pro Tip: Run your reconciliation check before you trust a single pricing decision to the dashboard. A five-minute audit on day one beats a week of decisions built on bad data.
How Should You Act on Sales Data Once You Have It?
Data without a trigger point is just a nicer-looking spreadsheet. The value comes from setting thresholds ahead of time and deciding, in advance, what happens when a number crosses them.
Set these triggers before your on-sale starts, not while you’re watching numbers move:
If sell-through reaches a strong level well before curtain, release your held inventory and consider a modest price increase.
If velocity noticeably drops week over week with no seasonal explanation, that’s your signal to launch a last-chance promotion rather than wait and hope.
If one referral channel is driving three times the conversion rate of the others, reallocate ad spend toward it before the campaign budget runs out elsewhere.
If comps and refunds are climbing faster than net sales, check for a fulfillment or communication problem before assuming it’s a demand issue.
Pricing actions follow directly from velocity and sell-through data: hold releases when sell-through outpaces plan, last-minute discounts when it lags, and dynamic price adjustments for the sections in between. Marketing actions mean shifting budget toward the channels that convert and activating partner promo codes that have been sitting unused.
Pro Tip: *Forecast staffing and entry logistics using your sell-through curve, not your final capacity number.
What Should a Simple Ticket Sales Tracker Include?
Even a basic spreadsheet works if it captures the right columns and gets updated on schedule.
Date, ticket type, quantity sold, unit price, and total revenue
Promo code or referral source for every transaction
Running sell-through percentage by section
Comps and refunds logged separately from gross sales
Element | Recommended cadence |
Velocity chart | Update daily; hourly during on-sale week |
Sell-through by section | Update daily |
Revenue vs. goal | Update daily |
Full CSV export | On-sale: daily; steady state: weekly |
Printable templates still earn their keep for single-event box offices with a handful of shows a year and no need to blend data across campaigns or platforms.
How Opti Arts Applies Ticket Sales Tracking for Cultural Organizations
Museums and theaters rarely have a marketing team large enough to stitch together ticketing exports and ad platform reports by hand every week. That’s the exact gap Optiarts built its approach to close, wiring ticketing data directly to campaign performance across Meta, Google, YouTube, and Streaming TV so a sale can be traced back to the dollar that produced it.
Dashboard views Optiarts builds for clients typically include:
Breakeven progress tracked against a season or single-run goal
Sell-through risk flagged by section, not just venue total
Campaign-level ROI showing which platform is actually moving tickets
A theater running a six-week season can watch orchestra sell-through pull ahead of the balcony in real time, then shift promo spend toward the sections that need it, days before opening night rather than after the reviews come in.
For smaller organizations without a dedicated analytics staffer, Optiarts provides onboarding support and starter templates so a five-person team gets the same visibility into results as a venue running a full season calendar.
What Most Ticket Sales Advice Gets Wrong
Most guidance on this topic treats tracking as a reporting exercise: pull the numbers, build the chart, send the recap. That’s backwards. Tracking only earns its keep when it triggers a decision, a price change, a reallocated ad dollar, a held section released two weeks early. A gorgeous dashboard nobody acts on is worse than no dashboard, because it creates the illusion of control while the same slow on-sale drifts toward opening night unaddressed.
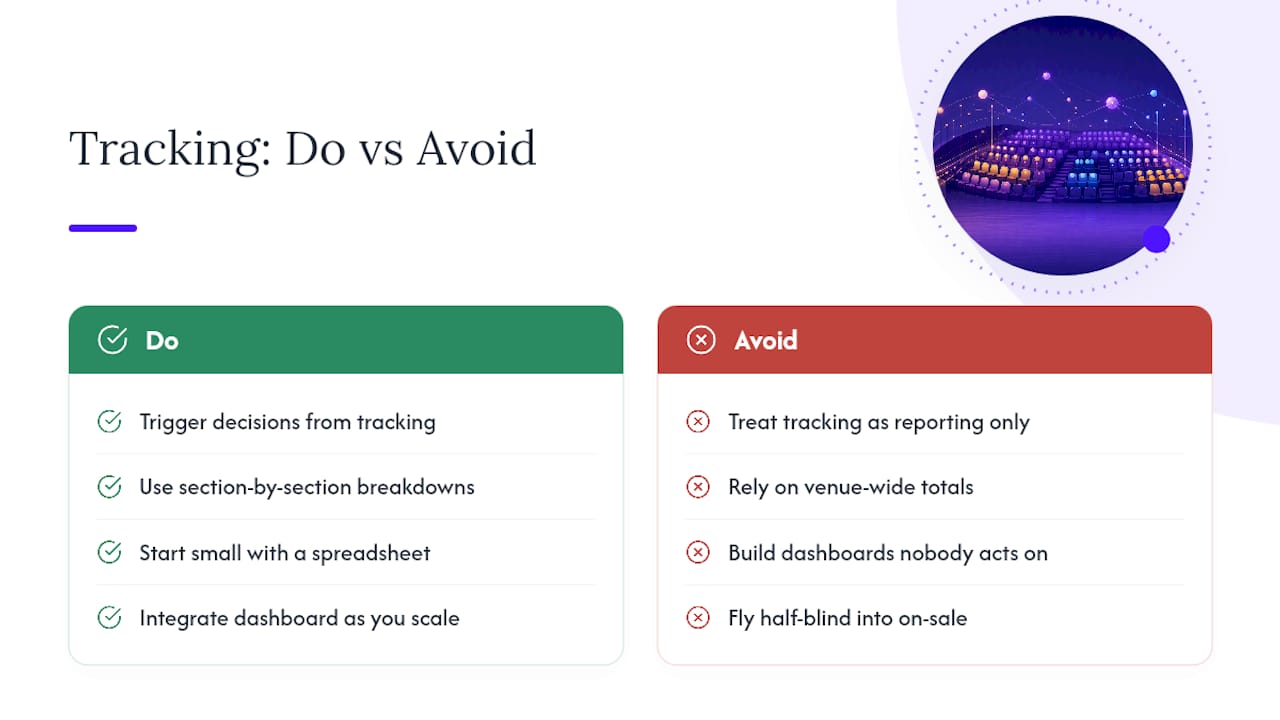
The conventional advice also overweights total sell-through and underweights the section-by-section breakdown. Venue-wide numbers hide real problems.
Start small if you need to. A spreadsheet with the right columns beats an expensive dashboard nobody trusts. But the moment you’re running more than a handful of shows a year, or blending paid campaigns with box office data, the case for an integrated dashboard stops being about convenience and starts being about not flying half-blind into your own on-sale.
— Trevor
Get a Live View of Every On-Sale with Breakeven
Optiarts built Breakeven specifically because cultural organizations were stitching together box office exports and ad platform reports by hand, usually a week too late to act on what they found. Breakeven wires your ticketing system directly to your campaign data, so sell-through, revenue against goal, and channel attribution all live on one screen instead of three disconnected ones.

A demo walks through your actual ticketing setup, not a generic sample account, so you see how sell-through by section and campaign ROI would look on your own upcoming season. You’ll also get a look at the onboarding support Optiarts provides for teams without a dedicated analytics staffer, including starter templates for smaller organizations still building out their reporting habits. If your team is tired of reconciling spreadsheets the morning after a promo push instead of adjusting mid-campaign, schedule a Breakeven demo and see what a wired-together dashboard actually looks like on a real on-sale.
Sources
Recommended